The most commonly used data table tool for data scientists is pandas; through pandas tables, tables (dataframes) and analysis tables can be easily displayed. The formatting of the table is not good, which will affect the analysis efficiency.
If a worker wants to do well, he must first sharpen his tools. Here are some commonly used setting methods:
- Show more lines
- Show more columns
- Change the column width
- Set the precision of the float column
- Number formatted display
- Change the drawing method
- Configure the output of info()
- Print out current settings and reset all options
1. show more rows
By default, pandas does not exceed the display range of the screen. If there are many rows in the table, it will truncate the middle row and display only part of it. Sometimes, if the total number of rows of data to be viewed is not many, you can control the maximum number of rows displayed by setting display.max_rows, for example, setting the display of 200 rows of data to view the data at one time:
import pandas as pd |
But when the number of rows of data exceeds display.max_rows, then display.min_rows will determine how many rows are in the displayed part. Because the default number of rows in display.min_rows is 10, the data is generally displayed as the first 5 rows of data and the last 5 rows of data.
In the same way, you can also display the number of rows that can be displayed according to your own habits, such as 20
pd.set_option('display.min_rows', 20) |
If you need to restore the default settings, you can reset to default conditions like this:
# reset |
2. Show more columns
The row can be set, the same column can be set, display.max_columns controls the number of columns that can be displayed, the default value is 20.
pd.get_option('display.max_columns') |
3. Change column width
pandas has some limits on the number of characters displayed in a column, the default is 50 characters. Therefore, if some value characters are too long, an ellipsis will be displayed. If you want to display all, you can set display.max_colwidth, for example, set it to 500.
pd.set_option('display.max_colwidth',500) |
4. Set the precision of the float column
For float data, pandas displays only 6 decimal places by default. We can set display.precision in advance to display only 2 digits to avoid repeated operations later.
pd.set_option('display.precision',2) |
This setting does not affect the underlying data, it only affects the display of floating columns.
5. Format the numbers
There is an option display.float_formatoption in pandas which can be used to format any float column. This only applies to floating point columns, for other data types, they must be converted to floating point numbers.
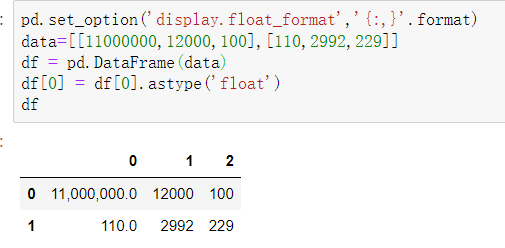
Format large value numbers with commas
Large numbers like 1200000 seem inconvenient, so we separate them with commas.
pd.set_option('display.float_format','{:,}'.format) |
set number precision
Similar to display.precision above, if we only care about 2 digits after the decimal point, we can format it like this:
pd.set_option('display.float_format', '{:,.2f}'.format) |
percentage sign formatting
If we want to display a percentage column, we can set it like this.
pd.set_option('display.float_format', '{:.2f}%'.format) |
6. Change the drawing method
By default, pandas uses matplotlib as the plotting backend. Starting from version 0.25, pandas provides options for using different backends, such as plotly, bokeh and other third-party libraries, but the premise is that you need to install them first.
The setup is very simple, as long as the third-party library is installed, it also only needs one line.
import pandas as pd |
7. Configure the output of info()
In pandas, we often use info() to quickly view the data of the DataFrame. However, the info method has a default limit on the maximum number of columns to analyze, and if there are nulls in the dataset, it will be very slow when counting statistics on large datasets.
pandas provides two options:
display.max_info_columns: Set the maximum number of columns to analyze, the default is 100.
display.max_info_rows: Set the threshold when the count is null, the default is 1690785.
For example, when analyzing a dataset with 150 features, we can set display.max_info_columns to a value that covers all columns, such as setting it to 200:
pd.set_option('display.max_info_columns', 200) |
When analyzing large datasets, df.info() is slow due to calculating all nulls. So we can simply set display.max_info_rows to a small value to avoid counting, e.g. only count null if the number of rows does not exceed 5:
pd.set_option('display.max_info_rows', 5) |
8. Print out current settings and reset all options
pd.describe_option() will print out the description of the setting and its current value.
pd.describe_option() |
You can also print certain options, such as line display.
# specific search |
Finally, we can also reset all directly.
pd.reset_option('all') |
Summarize
The above is the use of commonly used set_option, you can set it as follows at one time:
pd.set_option('display.max_rows',xxx) # maximum number of rows |