multi line plot with seaborn


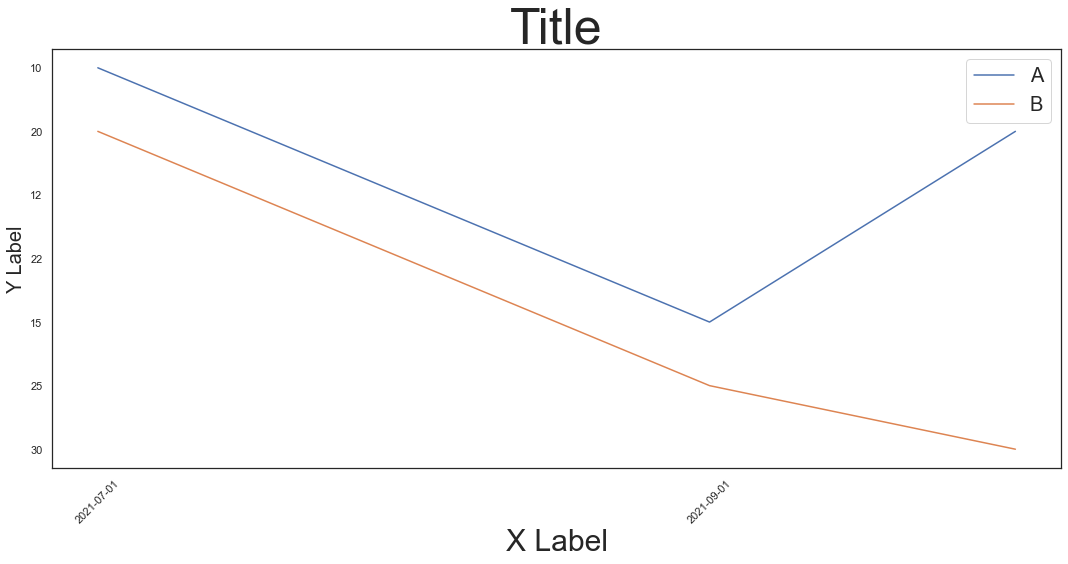
In this example, we show to do multi-plot graph using seaborn.
In addtion, some of the ways to change fonts sizes are also shown.

import seaborn as sns
import pandas as pd


data = [
['A','10','2021-07-01'],
['A','12','2021-08-01'],
['A','15','2021-09-01'],
['A','20','2021-10-01'],
['B','20','2021-07-01'],
['B','22','2021-08-01'],
['B','25','2021-09-01'],
['B','30','2021-10-01'],

]

df = pd.DataFrame(data=data, columns=['company','price','date'])
display(df)

company price date
0 A 10 2021-07-01
1 A 12 2021-08-01
2 A 15 2021-09-01
3 A 20 2021-10-01
4 B 20 2021-07-01
5 B 22 2021-08-01
6 B 25 2021-09-01
7 B 30 2021-10-01
# global change the font scales of the sns plot for easy set up
sns.set(font_scale=2)
sns.set(style='white')
from matplotlib import pyplot as plt

plt.figure(figsize=(15,8))


temp = df.sort_values(by='date')

plot_= sns.lineplot(x="date", y="price", hue="company", data=temp)


# in case too many data points, we can skip some ticks on the x axis
for ind, label in enumerate(plot_.get_xticklabels()):

if ind % 2 == 0: # every second label is kept
label.set_visible(True)
else:
label.set_visible(False)

# adjust fonrt size of x axis , y axis and title

#plot_.set_title('example plot')
plot_.axes.set_title("Title",fontsize=50)
plot_.set_xlabel("X Label",fontsize=30)
plot_.set_ylabel("Y Label",fontsize=20)


# adjust lengend font size
plot_.legend(fontsize=20)

plt.xticks(rotation=45)
plt.tight_layout()
plt.grid(False)


plt.show()

png


Author: robot learner
Reprint policy: All articles in this blog are used except for special statements CC BY 4.0 reprint policy. If reproduced, please indicate source robot learner !
  TOC