install the latest seaborn package if not installed
!pip install seaborn==0.11.2
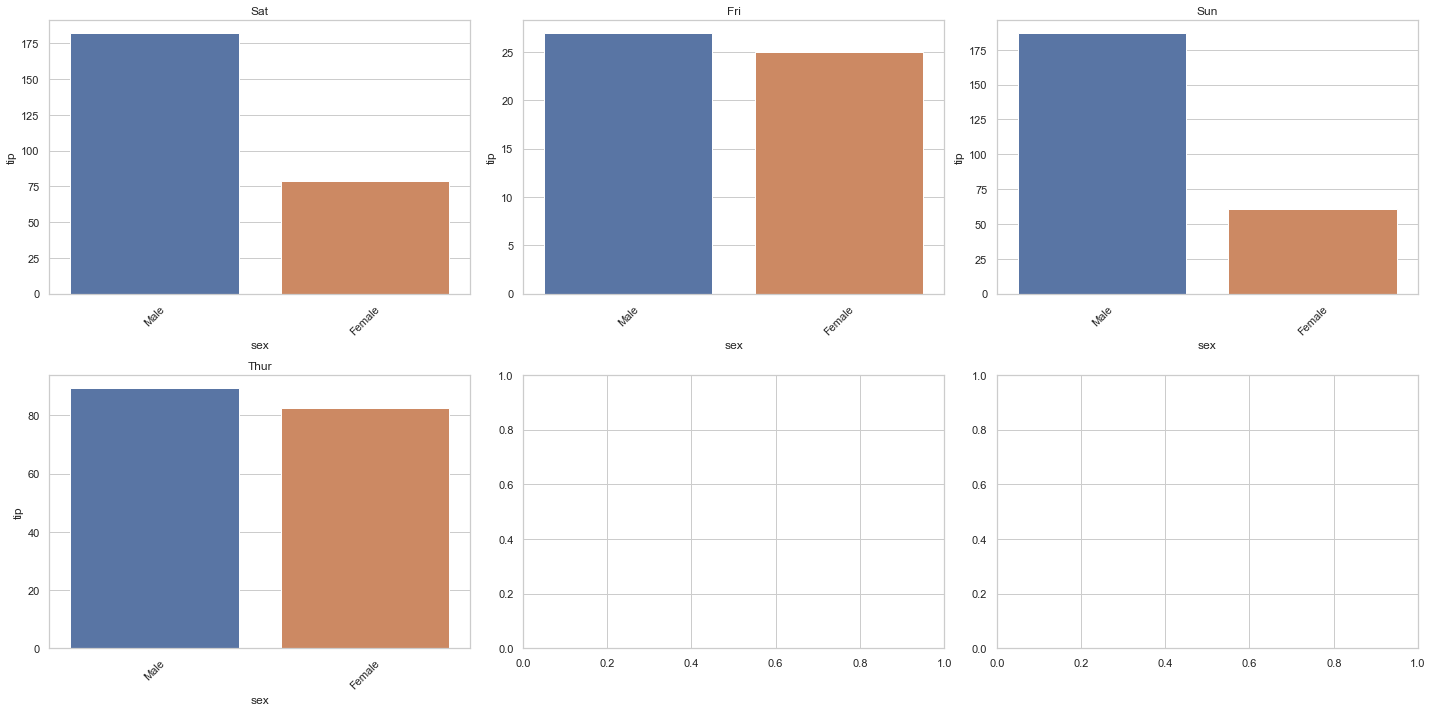
visualize the total tips of male vs female, for each different weekday in the data
from matplotlib import pyplot as plt import seaborn as sns import math
# automatically adjust the rows and colums all_days = list(set(tips_agg['day'])) n_cols = 3 n_rows = math.ceil(len(all_days)/n_cols)
# give the figsize fig, axes = plt.subplots( n_rows, n_cols, figsize=(20, 10))
for i inrange(n_rows): for j inrange(n_cols): index = i*n_cols+j if index >= len(all_days): break
day = all_days[index] bp = sns.barplot(ax=axes[i, j], data=tips_agg[tips_agg['day']==day], x='sex', y='tip') bp.set(title=day) for item in bp.get_xticklabels(): item.set_rotation(45)
# if the x axis title is very long, this configuration will be very useful plt.tight_layout()
Reprint policy:
All articles in this blog are used except for special statements
CC BY 4.0
reprint policy. If reproduced, please indicate source
robot learner
!